- Numerical modeling of SNSPD absorption utilizing optical conductivity with quantum corrections Superconducting nanowire single-photon detectors are widely used in various fields of physics and technology, due to their high efficiency and timing precision. Although, in principle, their detection mechanism offers broadband operation, their wavelength range has to be optimized by the optical cavity parameters for a specific task. We present a study of the optical absorption of a superconducting nanowire single photon detector (SNSPD) with an optical cavity. The optical properties of the niobium nitride films, measured by spectroscopic ellipsometry, were modelled using the Drude-Lorentz model with quantum corrections. The numerical simulations of the optical response of the detectors show that the wavelength range of the detector is not solely determined by its geometry, but the optical conductivity of the disordered thin metallic films contributes considerably. This contribution can be conveniently expressed by the ratio of imaginary and real parts of the optical conductivity. This knowledge can be utilized in detector design. 4 authors · Aug 1, 2024
- Optical Properties of Superconducting K$_{0.8}$Fe$_{1.7}$(Se$_{0.73}$S$_{0.27}$)$_2$ Single Crystals The optical properties of the superconducting K_{0.8}Fe_{1.7}(Se_{0.73}S_{0.27})_2 single crystals with a critical temperature T_capprox 26 K have been measured in the {\it ab} plane in a wide frequency range using both infrared Fourier-transform spectroscopy and spectroscopic ellipsometry at temperatures of 4--300 K. The normal-state reflectance of K_{0.8}Fe_{1.7}(Se_{0.73}S_{0.27})_2 is analyzed using a Drude-Lorentz model with one Drude component. The temperature dependences of the plasma frequency, optical conductivity, scattering rate, and dc resistivity of the Drude contribution in the normal state are presented. In the superconducting state, we observe a signature of the superconducting gap opening at 2Δ(5~K) = 11.8~meV. An abrupt decrease in the low-frequency dielectric permittivity varepsilon _1(ω) at T < T_c also evidences the formation of the superconducting condensate. The superconducting plasma frequency ω_{pl,s} = (213pm 5)~cm^{-1} and the magnetic penetration depth λ=(7.5pm 0.2)~μm at T=5~K are determined. 5 authors · Nov 14
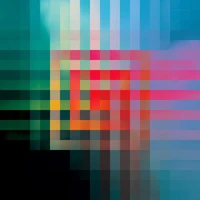
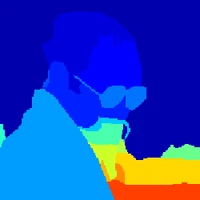
- Spectral and Polarization Vision: Spectro-polarimetric Real-world Dataset Image datasets are essential not only in validating existing methods in computer vision but also in developing new methods. Most existing image datasets focus on trichromatic intensity images to mimic human vision. However, polarization and spectrum, the wave properties of light that animals in harsh environments and with limited brain capacity often rely on, remain underrepresented in existing datasets. Although spectro-polarimetric datasets exist, these datasets have insufficient object diversity, limited illumination conditions, linear-only polarization data, and inadequate image count. Here, we introduce two spectro-polarimetric datasets: trichromatic Stokes images and hyperspectral Stokes images. These novel datasets encompass both linear and circular polarization; they introduce multiple spectral channels; and they feature a broad selection of real-world scenes. With our dataset in hand, we analyze the spectro-polarimetric image statistics, develop efficient representations of such high-dimensional data, and evaluate spectral dependency of shape-from-polarization methods. As such, the proposed dataset promises a foundation for data-driven spectro-polarimetric imaging and vision research. Dataset and code will be publicly available. 7 authors · Nov 29, 2023
- Estimation of Classical Cepheid's Physical Parameters from NIR Light Curves Recent space-borne and ground-based observations provide photometric measurements as time series. The effect of interstellar dust extinction in the near-infrared range is only 10% of that measured in the V band. However, the sensitivity of the light curve shape to the physical parameters in the near-infrared is much lower. So, interpreting these types of data sets requires new approaches like the different large-scale surveys, which create similar problems with big data. Using a selected data set, we provide a method for applying routines implemented in R to extract most information of measurements to determine physical parameters, which can also be used in automatic classification schemes and pipeline processing. We made a multivariate classification of 131 Cepheid light curves (LC) in J, H, and K colors, where all the LCs were represented in 20D parameter space in these colors separately. Performing a Principal Component Analysis (PCA), we got an orthogonal coordinate system and squared Euclidean distances between LCs, with 6 significant eigenvalues, reducing the 20-dimension to 6. We also estimated the optimal number of partitions of similar objects and found it to be equal to 7 in each color; their dependence on the period, absolute magnitude, amplitude, and metallicity are also discussed. We computed the Spearman rank correlations, showing that periods and absolute magnitudes correlate with the first three PCs significantly. The first two PC are also found to have a relationship with the amplitude, but the metallicity effects are only marginal. The method shown can be generalized and implemented in unsupervised classification schemes and analysis of mixed and biased samples. The analysis of our Classical Cepheid near-infrared LC sample showed that the J, H, K curves are insufficient for determination of stellar metallicity, with mass being the key factor shaping them. 2 authors · Dec 9, 2024
- Modeling Temperature, Frequency, and Strain Effects on the Linear Electro-Optic Coefficients of Ferroelectric Oxides An electro-optic modulator offers the function of modulating the propagation of light in a material with electric field and enables seamless connection between electronics-based computing and photonics-based communication. The search for materials with large electro-optic coefficients and low optical loss is critical to increase the efficiency and minimize the size of electro-optic devices. We present a semi-empirical method to compute the electro-optic coefficients of ferroelectric materials by combining first-principles density-functional theory calculations with Landau-Devonshire phenomenological modeling. We apply the method to study the electro-optic constants, also called Pockels coefficients, of three paradigmatic ferroelectric oxides: BaTiO3, LiNbO3, and LiTaO3. We present their temperature-, frequency- and strain-dependent electro-optic tensors calculated using our method. The predicted electro-optic constants agree with the experimental results, where available, and provide benchmarks for experimental verification. 5 authors · Jun 5, 2021
- Interferometer response characterization algorithm for multi-aperture Fabry-Perot imaging spectrometers In recent years, the demand for hyperspectral imaging devices has grown significantly, driven by their ability of capturing high-resolution spectral information. Among the several possible optical designs for acquiring hyperspectral images, there is a growing interest in interferometric spectral imaging systems based on division of aperture. These systems have the advantage of capturing snapshot acquisitions while maintaining a compact design. However, they require a careful calibration to operate properly. In this work, we present the interferometer response characterization algorithm (IRCA), a robust three-step procedure designed to characterize the transmittance response of multi-aperture imaging spectrometers based on the interferometry of Fabry-Perot. Additionally, we propose a formulation of the image formation model for such devices suitable to estimate the parameters of interest by considering the model under various regimes of finesse. The proposed algorithm processes the image output obtained from a set of monochromatic light sources and refines the results using nonlinear regression after an ad-hoc initialization. Through experimental analysis conducted on four different prototypes from the Image SPectrometer On Chip (ImSPOC) family, we validate the performance of our approach for characterization. The associated source code for this paper is available at https://github.com/danaroth83/irca. 5 authors · Mar 24, 2023
- Generating arbitrary polarization states by manipulating the thicknesses of a pair of uniaxial birefringent plates We report an optical method of generating arbitrary polarization states by manipulating the thicknesses of a pair of uniaxial birefringent plates, the optical axes of which are set at a crossing angle of {\pi}/4. The method has the remarkable feature of being able to generate a distribution of arbitrary polarization states in a group of highly discrete spectra without spatially separating the individual spectral components. The target polarization-state distribution is obtained as an optimal solution through an exploration. Within a realistic exploration range, a sufficient number of near-optimal solutions are found. This property is also reproduced well by a concise model based on a distribution of exploration points on a Poincar\'e sphere, showing that the number of near-optimal solutions behaves according to a power law with respect to the number of spectral components of concern. As a typical example of an application, by applying this method to a set of phase-locked highly discrete spectra, we numerically demonstrate the continuous generation of a vector-like optical electric field waveform, the helicity of which is alternated within a single optical cycle in the time domain. 4 authors · Aug 1, 2023
- Galaxy Spectra neural Networks (GaSNets). I. Searching for strong lens candidates in eBOSS spectra using Deep Learning With the advent of new spectroscopic surveys from ground and space, observing up to hundreds of millions of galaxies, spectra classification will become overwhelming for standard analysis techniques. To prepare for this challenge, we introduce a family of deep learning tools to classify features in one-dimensional spectra. As the first application of these Galaxy Spectra neural Networks (GaSNets), we focus on tools specialized at identifying emission lines from strongly lensed star-forming galaxies in the eBOSS spectra. We first discuss the training and testing of these networks and define a threshold probability, PL, of 95% for the high quality event detection. Then, using a previous set of spectroscopically selected strong lenses from eBOSS, confirmed with HST, we estimate a completeness of ~80% as the fraction of lenses recovered above the adopted PL. We finally apply the GaSNets to ~1.3M spectra to collect a first list of ~430 new high quality candidates identified with deep learning applied to spectroscopy and visually graded as highly probable real events. A preliminary check against ground-based observations tentatively shows that this sample has a confirmation rate of 38%, in line with previous samples selected with standard (no deep learning) classification tools and follow-up by Hubble Space Telescope. This first test shows that machine learning can be efficiently extended to feature recognition in the wavelength space, which will be crucial for future surveys like 4MOST, DESI, Euclid, and the Chinese Space Station Telescope (CSST). 3 authors · Feb 16, 2022
- Can photonic heterostructures provably outperform single-material geometries? Recent advances in photonic optimization have enabled calculation of performance bounds for a wide range of electromagnetic objectives, albeit restricted to single-material systems. Motivated by growing theoretical interest and fabrication advances, we present a framework to bound the performance of photonic heterostructures and apply it to investigate maximum absorption characteristics of multilayer films and compact, free-form multi-material scatterers. Limits predict trends seen in topology-optimized geometries -- often coming within factors of two of specific designs -- and may be exploited in conjunction with inverse designs to predict when heterostructures are expected to outperform their optimal single-material counterparts. 5 authors · Jul 2, 2023
7 DiffSpectra: Molecular Structure Elucidation from Spectra using Diffusion Models Molecular structure elucidation from spectra is a foundational problem in chemistry, with profound implications for compound identification, synthesis, and drug development. Traditional methods rely heavily on expert interpretation and lack scalability. Pioneering machine learning methods have introduced retrieval-based strategies, but their reliance on finite libraries limits generalization to novel molecules. Generative models offer a promising alternative, yet most adopt autoregressive SMILES-based architectures that overlook 3D geometry and struggle to integrate diverse spectral modalities. In this work, we present DiffSpectra, a generative framework that directly infers both 2D and 3D molecular structures from multi-modal spectral data using diffusion models. DiffSpectra formulates structure elucidation as a conditional generation process. Its denoising network is parameterized by Diffusion Molecule Transformer, an SE(3)-equivariant architecture that integrates topological and geometric information. Conditioning is provided by SpecFormer, a transformer-based spectral encoder that captures intra- and inter-spectral dependencies from multi-modal spectra. Extensive experiments demonstrate that DiffSpectra achieves high accuracy in structure elucidation, recovering exact structures with 16.01% top-1 accuracy and 96.86% top-20 accuracy through sampling. The model benefits significantly from 3D geometric modeling, SpecFormer pre-training, and multi-modal conditioning. These results highlight the effectiveness of spectrum-conditioned diffusion modeling in addressing the challenge of molecular structure elucidation. To our knowledge, DiffSpectra is the first framework to unify multi-modal spectral reasoning and joint 2D/3D generative modeling for de novo molecular structure elucidation. 10 authors · Jul 9 1
- Understanding of the properties of neural network approaches for transient light curve approximations Modern-day time-domain photometric surveys collect a lot of observations of various astronomical objects and the coming era of large-scale surveys will provide even more information on their properties. Spectroscopic follow-ups are especially crucial for transients such as supernovae and most of these objects have not been subject to such studies. }{Flux time series are actively used as an affordable alternative for photometric classification and characterization, for instance, peak identifications and luminosity decline estimations. However, the collected time series are multidimensional and irregularly sampled, while also containing outliers and without any well-defined systematic uncertainties. This paper presents a search for the best-performing methods to approximate the observed light curves over time and wavelength for the purpose of generating time series with regular time steps in each passband.}{We examined several light curve approximation methods based on neural networks such as multilayer perceptrons, Bayesian neural networks, and normalizing flows to approximate observations of a single light curve. Test datasets include simulated PLAsTiCC and real Zwicky Transient Facility Bright Transient Survey light curves of transients.}{The tests demonstrate that even just a few observations are enough to fit the networks and improve the quality of approximation, compared to state-of-the-art models. The methods described in this work have a low computational complexity and are significantly faster than Gaussian processes. Additionally, we analyzed the performance of the approximation techniques from the perspective of further peak identification and transients classification. The study results have been released in an open and user-friendly Fulu Python library available on GitHub for the scientific community. 7 authors · Sep 15, 2022
- An open-source robust machine learning platform for real-time detection and classification of 2D material flakes The most widely used method for obtaining high-quality two-dimensional materials is through mechanical exfoliation of bulk crystals. Manual identification of suitable flakes from the resulting random distribution of crystal thicknesses and sizes on a substrate is a time-consuming, tedious task. Here, we present a platform for fully automated scanning, detection, and classification of two-dimensional materials, the source code of which we make openly available. Our platform is designed to be accurate, reliable, fast, and versatile in integrating new materials, making it suitable for everyday laboratory work. The implementation allows fully automated scanning and analysis of wafers with an average inference time of 100 ms for images of 2.3 Mpixels. The developed detection algorithm is based on a combination of the flakes' optical contrast toward the substrate and their geometric shape. We demonstrate that it is able to detect the majority of exfoliated flakes of various materials, with an average recall (AR50) between 67% and 89%. We also show that the algorithm can be trained with as few as five flakes of a given material, which we demonstrate for the examples of few-layer graphene, WSe_2, MoSe_2, CrI_3, 1T-TaS_2 and hexagonal BN. Our platform has been tested over a two-year period, during which more than 10^6 images of multiple different materials were acquired by over 30 individual researchers. 11 authors · Jun 26, 2023
- Polarization aberrations in next-generation Giant Segmented Mirror Telescopes (GSMTs). II. Influence of segment-to-segment coating variations on high-contrast imaging and polarimetry Direct exo-Earth imaging is a key science goal for astronomy in the next decade. This ambitious task imposes a target contrast of ~10^-7 at wavelengths from I to J-band. In our prior study, we determined that polarization aberrations can limit the achievable contrast to 10^-5 to 10^-6 in the infrared. However, these results assumed a perfect coronagraph coupled to a telescope with an ideal coating on each of the mirrors. In this study we seek to understand the influence of polarization aberrations from segment-to-segment coating variations on coronagraphy and polarimetry. We use the Poke open-source polarization ray tracing package to compute the Jones pupil of each GSMT with spatially-varying coatings applied to the segments. The influence of the resultant polarization aberrations is simulated by propagating the Jones pupil through physical optics models of coronagraphs using HCIPy. After applying wavefront control from an ideal adaptive optics system, we determine that the segment-to-segment variations applied limit the performance of coronagraphy to a raw contrast of approximately 10^-8 in I-band, which is 2-3 orders of magnitude lower the target performance for high-contrast imaging systems on the ground. This is a negligible addition to the nominal polarization aberrations for ground-based systems. We further observe negligible degradation in polarimetric imaging of debris disks from segment-to-segment aberrations above and beyond the impact of nominal polarization aberration. 11 authors · Jan 7
- First Light And Reionisation Epoch Simulations (FLARES) VI: The colour evolution of galaxies z=5-15 With its exquisite sensitivity, wavelength coverage, and spatial and spectral resolution, the James Webb Space Telescope is poised to revolutionise our view of the distant, high-redshift (z>5) Universe. While Webb's spectroscopic observations will be transformative for the field, photometric observations play a key role in identifying distant objects and providing more comprehensive samples than accessible to spectroscopy alone. In addition to identifying objects, photometric observations can also be used to infer physical properties and thus be used to constrain galaxy formation models. However, inferred physical properties from broadband photometric observations, particularly in the absence of spectroscopic redshifts, often have large uncertainties. With the development of new tools for forward modelling simulations it is now routinely possible to predict observational quantities, enabling a direct comparison with observations. With this in mind, in this work, we make predictions for the colour evolution of galaxies at z=5-15 using the FLARES: First Light And Reionisation Epoch Simulations cosmological hydrodynamical simulation suite. We predict a complex evolution, driven predominantly by strong nebular line emission passing through individual bands. These predictions are in good agreement with existing constraints from Hubble and Spitzer as well as some of the first results from Webb. We also contrast our predictions with other models in the literature: while the general trends are similar we find key differences, particularly in the strength of features associated with strong nebular line emission. This suggests photometric observations alone should provide useful discriminating power between different models. 9 authors · Jul 22, 2022
- Indirect measurement of atomic magneto-optical rotation via Hilbert transform The Kramers-Kronig relations are a pivotal foundation of linear optics and atomic physics, embedding a physical connection between the real and imaginary components of any causal response function. A mathematically equivalent, but simpler, approach instead utilises the Hilbert transform. In a previous study, the Hilbert transform was applied to absorption spectra in order to infer the sole refractive index of an atomic medium in the absence of an external magnetic field. The presence of a magnetic field causes the medium to become birefringent and dichroic, and therefore it is instead characterised by two refractive indices. In this study, we apply the same Hilbert transform technique to independently measure both refractive indices of a birefringent atomic medium, leading to an indirect measurement of atomic magneto-optical rotation. Key to this measurement is the insight that inputting specific light polarisations into an atomic medium induces absorption associated with only one of the refractive indices. We show this is true in two configurations, commonly referred to in literature as the Faraday and Voigt geometries, which differ by the magnetic field orientation with respect to the light wavevector. For both cases, we measure the two refractive indices independently for a Rb thermal vapour in a 0.6 T magnetic field, finding excellent agreement with theory. This study further emphasises the application of the Hilbert transform to the field of quantum and atomic optics in the linear regime. 4 authors · Mar 1, 2024
- JARVIS-Leaderboard: A Large Scale Benchmark of Materials Design Methods Lack of rigorous reproducibility and validation are major hurdles for scientific development across many fields. Materials science in particular encompasses a variety of experimental and theoretical approaches that require careful benchmarking. Leaderboard efforts have been developed previously to mitigate these issues. However, a comprehensive comparison and benchmarking on an integrated platform with multiple data modalities with both perfect and defect materials data is still lacking. This work introduces JARVIS-Leaderboard, an open-source and community-driven platform that facilitates benchmarking and enhances reproducibility. The platform allows users to set up benchmarks with custom tasks and enables contributions in the form of dataset, code, and meta-data submissions. We cover the following materials design categories: Artificial Intelligence (AI), Electronic Structure (ES), Force-fields (FF), Quantum Computation (QC) and Experiments (EXP). For AI, we cover several types of input data, including atomic structures, atomistic images, spectra, and text. For ES, we consider multiple ES approaches, software packages, pseudopotentials, materials, and properties, comparing results to experiment. For FF, we compare multiple approaches for material property predictions. For QC, we benchmark Hamiltonian simulations using various quantum algorithms and circuits. Finally, for experiments, we use the inter-laboratory approach to establish benchmarks. There are 1281 contributions to 274 benchmarks using 152 methods with more than 8 million data-points, and the leaderboard is continuously expanding. The JARVIS-Leaderboard is available at the website: https://pages.nist.gov/jarvis_leaderboard 38 authors · Jun 20, 2023
- Large-scale optical characterization of solid-state quantum emitters Solid-state quantum emitters have emerged as a leading quantum memory for quantum networking applications. However, standard optical characterization techniques are neither efficient nor repeatable at scale. In this work, we introduce and demonstrate spectroscopic techniques that enable large-scale, automated characterization of color centers. We first demonstrate the ability to track color centers by registering them to a fabricated machine-readable global coordinate system, enabling systematic comparison of the same color center sites over many experiments. We then implement resonant photoluminescence excitation in a widefield cryogenic microscope to parallelize resonant spectroscopy, achieving two orders of magnitude speed-up over confocal microscopy. Finally, we demonstrate automated chip-scale characterization of color centers and devices at room temperature, imaging thousands of microscope fields of view. These tools will enable accelerated identification of useful quantum emitters at chip-scale, enabling advances in scaling up color center platforms for quantum information applications, materials science, and device design and characterization. 13 authors · Oct 24, 2022
1 SPIDeRS: Structured Polarization for Invisible Depth and Reflectance Sensing Can we capture shape and reflectance in stealth? Such capability would be valuable for many application domains in vision, xR, robotics, and HCI. We introduce Structured Polarization, the first depth and reflectance sensing method using patterns of polarized light (SPIDeRS). The key idea is to modulate the angle of linear polarization (AoLP) of projected light at each pixel. The use of polarization makes it invisible and lets us recover not only depth but also directly surface normals and even reflectance. We implement SPIDeRS with a liquid crystal spatial light modulator (SLM) and a polarimetric camera. We derive a novel method for robustly extracting the projected structured polarization pattern from the polarimetric object appearance. We evaluate the effectiveness of SPIDeRS by applying it to a number of real-world objects. The results show that our method successfully reconstructs object shapes of various materials and is robust to diffuse reflection and ambient light. We also demonstrate relighting using recovered surface normals and reflectance. We believe SPIDeRS opens a new avenue of polarization use in visual sensing. 3 authors · Dec 7, 2023
1 PCB-Vision: A Multiscene RGB-Hyperspectral Benchmark Dataset of Printed Circuit Boards Addressing the critical theme of recycling electronic waste (E-waste), this contribution is dedicated to developing advanced automated data processing pipelines as a basis for decision-making and process control. Aligning with the broader goals of the circular economy and the United Nations (UN) Sustainable Development Goals (SDG), our work leverages non-invasive analysis methods utilizing RGB and hyperspectral imaging data to provide both quantitative and qualitative insights into the E-waste stream composition for optimizing recycling efficiency. In this paper, we introduce 'PCB-Vision'; a pioneering RGB-hyperspectral printed circuit board (PCB) benchmark dataset, comprising 53 RGB images of high spatial resolution paired with their corresponding high spectral resolution hyperspectral data cubes in the visible and near-infrared (VNIR) range. Grounded in open science principles, our dataset provides a comprehensive resource for researchers through high-quality ground truths, focusing on three primary PCB components: integrated circuits (IC), capacitors, and connectors. We provide extensive statistical investigations on the proposed dataset together with the performance of several state-of-the-art (SOTA) models, including U-Net, Attention U-Net, Residual U-Net, LinkNet, and DeepLabv3+. By openly sharing this multi-scene benchmark dataset along with the baseline codes, we hope to foster transparent, traceable, and comparable developments of advanced data processing across various scientific communities, including, but not limited to, computer vision and remote sensing. Emphasizing our commitment to supporting a collaborative and inclusive scientific community, all materials, including code, data, ground truth, and masks, will be accessible at https://github.com/hifexplo/PCBVision. 6 authors · Jan 12, 2024
- A low-cost ultraviolet-to-infrared absolute quantum efficiency characterization system of detectors We present a low-cost ultraviolet to infrared absolute quantum efficiency detector characterization system developed using commercial off-the-shelf components. The key components of the experiment include a light source,a regulated power supply, a monochromator, an integrating sphere, and a calibrated photodiode. We provide a step-by-step procedure to construct the photon and quantum efficiency transfer curves of imaging sensors. We present results for the GSENSE 2020 BSI CMOS sensor and the Sony IMX 455 BSI CMOS sensor. As a reference for similar characterizations, we provide a list of parts and associated costs along with images of our setup. 11 authors · Jul 26, 2022
- Imaging and controlling electron motion and chemical structural dynamics of biological system in real time and space Ultrafast electron microscopy (UEM) has found widespread applications in physics, chemistry, and materials science, enabling real-space imaging of dynamics on ultrafast timescales. Recent advances have pushed the temporal resolution of UEM into the attosecond regime, enabling the attomicroscopy technique to directly visualize electron motion. In this work, we extend the capabilities of this powerful imaging tool to investigate ultrafast electron dynamics in a biological system by imaging and controlling light induced electronic and chemical changes in the conductive network of multicellular cable bacteria. Using electron energy loss spectroscopy (EELS), we first observed a laser induced increase in {\pi}-electron density, accompanied by spectral peak broadening and a blueshift features indicative of enhanced conductivity and structural modification. We also traced the effect of ultrafast laser pumping on bulk plasmon electron oscillations by monitoring changes in the plasmon like resonance peak. Additionally, we visualized laser induced chemical structural changes in cable bacteria in real space. The imaging results revealed carbon enrichment alongside a depletion of nitrogen and oxygen, highlighting the controllability of chemical dynamics. Moreover, time resolved EELS measurements further revealed a picosecond scale decay and recovery of both {\pi}-electron and plasmonic features, attributed to electron phonon coupling. In addition to shedding light on the mechanism of electron motion in cable bacteria, these findings demonstrate ultrafast modulation and switching of conductivity, underscoring their potential as bio-optoelectronic components operating on ultrafast timescales. 7 authors · Oct 2
- Comparative Analysis of Phenomenological Approximations of the Light Curves of Eclipsing Binary Stars with Additional Parameters A comparative analysis of the special shapes (patterns, profiles) of the eclipses applied for the phenomenological modeling of the light curves of eclipsing binary stars is conducted. Families of functions are considered, generalizing local approximations (Andronov, 2010, 2012) and the functions theoretically unlimited in a width, based on a Gaussian (Mikulasek, 2015). For an analysis, the light curve of the star V0882 Car = 2MASS J11080308 - 6145589 of the classic Algol - subtype (\beta Persei) is used. By analyzing dozens of modified functions with additional parameters, it was chosen the 14 best ones according to the criterion of the least sum of squares of deviations. The best are the functions with an additional parameter, describing profiles, which are limited in phase. 3 authors · Nov 10, 2016
- A machine learning route between band mapping and band structure Electronic band structure (BS) and crystal structure are the two complementary identifiers of solid state materials. While convenient instruments and reconstruction algorithms have made large, empirical, crystal structure databases possible, extracting quasiparticle dispersion (closely related to BS) from photoemission band mapping data is currently limited by the available computational methods. To cope with the growing size and scale of photoemission data, we develop a pipeline including probabilistic machine learning and the associated data processing, optimization and evaluation methods for band structure reconstruction, leveraging theoretical calculations. The pipeline reconstructs all 14 valence bands of a semiconductor and shows excellent performance on benchmarks and other materials datasets. The reconstruction uncovers previously inaccessible momentum-space structural information on both global and local scales, while realizing a path towards integration with materials science databases. Our approach illustrates the potential of combining machine learning and domain knowledge for scalable feature extraction in multidimensional data. 12 authors · May 20, 2020
- Deep UV Silicon Polaritonic Metasurfaces for Enhancing Biomolecule Autofluorescence and Two-Dimensional Material Double-Resonance Raman Scattering High-performance DUV spectroscopy drives advancements in biomedical research, clinical diagnosis, and material science. Existing DUV resonant nanostructures face instability and photoluminescent noise challenges. We propose robust Si metasurfaces leveraging polaritonic resonances, a unique property driven by interband transitions, for enhanced nanophotonic sensing. Our polaritonic Kerker-type void metasurface enables double-resonance Raman scattering to analyze 2D semiconductors, improves biomolecule autofluorescence, and offers superior stability. This scalable platform unlocks versatile applications in interdisciplinary DUV spectroscopy and emerging nanomaterials research. 20 authors · Jan 1
- Aperture Diffraction for Compact Snapshot Spectral Imaging We demonstrate a compact, cost-effective snapshot spectral imaging system named Aperture Diffraction Imaging Spectrometer (ADIS), which consists only of an imaging lens with an ultra-thin orthogonal aperture mask and a mosaic filter sensor, requiring no additional physical footprint compared to common RGB cameras. Then we introduce a new optical design that each point in the object space is multiplexed to discrete encoding locations on the mosaic filter sensor by diffraction-based spatial-spectral projection engineering generated from the orthogonal mask. The orthogonal projection is uniformly accepted to obtain a weakly calibration-dependent data form to enhance modulation robustness. Meanwhile, the Cascade Shift-Shuffle Spectral Transformer (CSST) with strong perception of the diffraction degeneration is designed to solve a sparsity-constrained inverse problem, realizing the volume reconstruction from 2D measurements with Large amount of aliasing. Our system is evaluated by elaborating the imaging optical theory and reconstruction algorithm with demonstrating the experimental imaging under a single exposure. Ultimately, we achieve the sub-super-pixel spatial resolution and high spectral resolution imaging. The code will be available at: https://github.com/Krito-ex/CSST. 7 authors · Sep 27, 2023
1 Simulation-based Inference for Exoplanet Atmospheric Retrieval: Insights from winning the Ariel Data Challenge 2023 using Normalizing Flows Advancements in space telescopes have opened new avenues for gathering vast amounts of data on exoplanet atmosphere spectra. However, accurately extracting chemical and physical properties from these spectra poses significant challenges due to the non-linear nature of the underlying physics. This paper presents novel machine learning models developed by the AstroAI team for the Ariel Data Challenge 2023, where one of the models secured the top position among 293 competitors. Leveraging Normalizing Flows, our models predict the posterior probability distribution of atmospheric parameters under different atmospheric assumptions. Moreover, we introduce an alternative model that exhibits higher performance potential than the winning model, despite scoring lower in the challenge. These findings highlight the need to reevaluate the evaluation metric and prompt further exploration of more efficient and accurate approaches for exoplanet atmosphere spectra analysis. Finally, we present recommendations to enhance the challenge and models, providing valuable insights for future applications on real observational data. These advancements pave the way for more effective and timely analysis of exoplanet atmospheric properties, advancing our understanding of these distant worlds. 12 authors · Sep 17, 2023
- MetaDiT: Enabling Fine-grained Constraints in High-degree-of Freedom Metasurface Design Metasurfaces are ultrathin, engineered materials composed of nanostructures that manipulate light in ways unattainable by natural materials. Recent advances have leveraged computational optimization, machine learning, and deep learning to automate their design. However, existing approaches exhibit two fundamental limitations: (1) they often restrict the model to generating only a subset of design parameters, and (2) they rely on heavily downsampled spectral targets, which compromises both the novelty and accuracy of the resulting structures. The core challenge lies in developing a generative model capable of exploring a large, unconstrained design space while precisely capturing the intricate physical relationships between material parameters and their high-resolution spectral responses. In this paper, we introduce MetaDiT, a novel framework for high-fidelity metasurface design that addresses these limitations. Our approach leverages a robust spectrum encoder pretrained with contrastive learning, providing strong conditional guidance to a Diffusion Transformer-based backbone. Experiments demonstrate that MetaDiT outperforms existing baselines in spectral accuracy, we further validate our method through extensive ablation studies. Our code and model weights will be open-sourced to facilitate future research. 2 authors · Aug 7
- Eigenspectrum Analysis of Neural Networks without Aspect Ratio Bias Diagnosing deep neural networks (DNNs) through the eigenspectrum of weight matrices has been an active area of research in recent years. At a high level, eigenspectrum analysis of DNNs involves measuring the heavytailness of the empirical spectral densities (ESD) of weight matrices. It provides insight into how well a model is trained and can guide decisions on assigning better layer-wise training hyperparameters. In this paper, we address a challenge associated with such eigenspectrum methods: the impact of the aspect ratio of weight matrices on estimated heavytailness metrics. We demonstrate that matrices of varying sizes (and aspect ratios) introduce a non-negligible bias in estimating heavytailness metrics, leading to inaccurate model diagnosis and layer-wise hyperparameter assignment. To overcome this challenge, we propose FARMS (Fixed-Aspect-Ratio Matrix Subsampling), a method that normalizes the weight matrices by subsampling submatrices with a fixed aspect ratio. Instead of measuring the heavytailness of the original ESD, we measure the average ESD of these subsampled submatrices. We show that measuring the heavytailness of these submatrices with the fixed aspect ratio can effectively mitigate the aspect ratio bias. We validate our approach across various optimization techniques and application domains that involve eigenspectrum analysis of weights, including image classification in computer vision (CV) models, scientific machine learning (SciML) model training, and large language model (LLM) pruning. Our results show that despite its simplicity, FARMS uniformly improves the accuracy of eigenspectrum analysis while enabling more effective layer-wise hyperparameter assignment in these application domains. In one of the LLM pruning experiments, FARMS reduces the perplexity of the LLaMA-7B model by 17.3% when compared with the state-of-the-art method. 4 authors · Jun 6
- Snapshot hyperspectral imaging of intracellular lasers Intracellular lasers are emerging as powerful biosensors for multiplexed tracking and precision sensing of cells and their microenvironment. This sensing capacity is enabled by quantifying their narrow-linewidth emission spectra, which is presently challenging to do at high speeds. In this work, we demonstrate rapid snapshot hyperspectral imaging of intracellular lasers. Using integral field mapping with a microlens array and a diffraction grating, we obtain images of the spatial and spectral intensity distribution from a single camera acquisition. We demonstrate widefield hyperspectral imaging over a 3times3 mm^2 field of view and volumetric imaging over 250times250times800 mum^3 volumes with a spatial resolution of 5 mum and a spectral resolution of less than 0.8 nm. We evaluate the performance and outline the challenges and strengths of snapshot methods in the context of characterising the emission from intracellular lasers. This method offers new opportunities for a diverse range of applications, including high-throughput and long-term biosensing with intracellular lasers. 4 authors · Jun 1, 2023
- Spectral Retrieval with JWST Photometric data: a Case Study for HIP 65426 b Half of the JWST high-contrast imaging objects will only have photometric data {{as of Cycle 2}}. However, to better understand their atmospheric chemistry which informs formation origin, spectroscopic data are preferred. Using HIP 65426 b, we investigate to what extent planet properties and atmospheric chemical abundance can be retrieved with only JWST photometric data points (2.5-15.5 mum) in conjunction with ground-based archival low-resolution spectral data (1.0-2.3 mum). We find that the data is consistent with an atmosphere with solar metallicity and C/O ratios at 0.40 and 0.55. We rule out 10x solar metallicity and an atmosphere with C/O = 1.0. We also find strong evidence of silicate clouds but no sign of an enshrouding featureless {{dust}} extinction. This work offers guidance and cautionary tales on analyzing data in the absence of medium-to-high resolution spectral data. 1 authors · Sep 29, 2023
- OL-Transformer: A Fast and Universal Surrogate Simulator for Optical Multilayer Thin Film Structures Deep learning-based methods have recently been established as fast and accurate surrogate simulators for optical multilayer thin film structures. However, existing methods only work for limited types of structures with different material arrangements, preventing their applications towards diverse and universal structures. Here, we propose the Opto-Layer (OL) Transformer to act as a universal surrogate simulator for enormous types of structures. Combined with the technique of structure serialization, our model can predict accurate reflection and transmission spectra for up to 10^{25} different multilayer structures, while still achieving a six-fold degradation in simulation time compared to physical solvers. Further investigation reveals that the general learning ability comes from the fact that our model first learns the physical embeddings and then uses the self-attention mechanism to capture the hidden relationship of light-matter interaction between each layer. 3 authors · May 19, 2023
- PAH Emission Spectra and Band Ratios for Arbitrary Radiation Fields with the Single Photon Approximation We present a new method for generating emission spectra from polycyclic aromatic hydrocarbons (PAHs) in arbitrary radiation fields. We utilize the single-photon limit for PAH heating and emission to treat individual photon absorptions as independent events. This allows the construction of a set of single-photon emission "basis spectra" that can be scaled to produce an output emission spectrum given any input heating spectrum. We find that this method produces agreement with PAH emission spectra computed accounting for multi-photon effects to within simeq10% in the 3-20~{rm mu m} wavelength range for radiation fields with intensity U<100. We use this framework to explore the dependence of PAH band ratios on the radiation field spectrum across grain sizes, finding in particular a strong dependence of the 3.3 to 11.2~mum band ratio on radiation field hardness. A Python-based tool and a set of basis spectra that can be used to generate these emission spectra are made publicly available. 2 authors · Oct 19
- Robust Spectral Anomaly Detection in EELS Spectral Images via Three Dimensional Convolutional Variational Autoencoders We introduce a Three-Dimensional Convolutional Variational Autoencoder (3D-CVAE) for automated anomaly detection in Electron Energy Loss Spectroscopy Spectrum Imaging (EELS-SI) data. Our approach leverages the full three-dimensional structure of EELS-SI data to detect subtle spectral anomalies while preserving both spatial and spectral correlations across the datacube. By employing negative log-likelihood loss and training on bulk spectra, the model learns to reconstruct bulk features characteristic of the defect-free material. In exploring methods for anomaly detection, we evaluated both our 3D-CVAE approach and Principal Component Analysis (PCA), testing their performance using Fe L-edge peak shifts designed to simulate material defects. Our results show that 3D-CVAE achieves superior anomaly detection and maintains consistent performance across various shift magnitudes. The method demonstrates clear bimodal separation between normal and anomalous spectra, enabling reliable classification. Further analysis verifies that lower dimensional representations are robust to anomalies in the data. While performance advantages over PCA diminish with decreasing anomaly concentration, our method maintains high reconstruction quality even in challenging, noise-dominated spectral regions. This approach provides a robust framework for unsupervised automated detection of spectral anomalies in EELS-SI data, particularly valuable for analyzing complex material systems. 3 authors · Dec 16, 2024
- Promise and Peril: Stellar Contamination and Strict Limits on the Atmosphere Composition of TRAPPIST-1c from JWST NIRISS Transmission Spectra Attempts to probe the atmospheres of rocky planets around M dwarfs present both promise and peril. While their favorable planet-to-star radius ratios enable searches for even thin secondary atmospheres, their high activity levels and high-energy outputs threaten atmosphere survival. Here, we present the 0.6--2.85\,mum transmission spectrum of the 1.1\,rm R_oplus, sim340\,K rocky planet TRAPPIST-1\,c obtained over two JWST NIRISS/SOSS transit observations. Each of the two spectra displays 100--500\,ppm signatures of stellar contamination. Despite being separated by 367\,days, the retrieved spot and faculae properties are consistent between the two visits, resulting in nearly identical transmission spectra. Jointly retrieving for stellar contamination and a planetary atmosphere reveals that our spectrum can rule out hydrogen-dominated, lesssim300times solar metallicity atmospheres with effective surface pressures down to 10\,mbar at the 3-sigma level. For high-mean molecular weight atmospheres, where O_2 or N_2 is the background gas, our spectrum disfavors partial pressures of more than sim10\,mbar for H_2O, CO, NH_3 and CH_4 at the 2-sigma level. Similarly, under the assumption of a 100\% H_2O, NH_3, CO, or CH_4 atmosphere, our spectrum disfavors thick, >1\,bar atmospheres at the 2-sigma level. These non-detections of spectral features are in line with predictions that even heavier, CO_2-rich, atmospheres would be efficiently lost on TRAPPIST-1\,c given the cumulative high-energy irradiation experienced by the planet. Our results further stress the importance of robustly accounting for stellar contamination when analyzing JWST observations of exo-Earths around M dwarfs, as well as the need for high-fidelity stellar models to search for the potential signals of thin secondary atmospheres. 12 authors · Sep 28, 2024
- MaskTerial: A Foundation Model for Automated 2D Material Flake Detection The detection and classification of exfoliated two-dimensional (2D) material flakes from optical microscope images can be automated using computer vision algorithms. This has the potential to increase the accuracy and objectivity of classification and the efficiency of sample fabrication, and it allows for large-scale data collection. Existing algorithms often exhibit challenges in identifying low-contrast materials and typically require large amounts of training data. Here, we present a deep learning model, called MaskTerial, that uses an instance segmentation network to reliably identify 2D material flakes. The model is extensively pre-trained using a synthetic data generator, that generates realistic microscopy images from unlabeled data. This results in a model that can to quickly adapt to new materials with as little as 5 to 10 images. Furthermore, an uncertainty estimation model is used to finally classify the predictions based on optical contrast. We evaluate our method on eight different datasets comprising five different 2D materials and demonstrate significant improvements over existing techniques in the detection of low-contrast materials such as hexagonal boron nitride. 7 authors · Dec 12, 2024
- MSA-3D: Metallicity Gradients in Galaxies at zsim1 with JWST/NIRSpec Slit-stepping Spectroscopy The radial gradient of gas-phase metallicity is a powerful probe of the chemical and structural evolution of star-forming galaxies, closely tied to disk formation and gas kinematics in the early universe. We present spatially resolved chemical and dynamical properties for a sample of 25 galaxies at 0.5 lesssim z lesssim 1.7 from the \msasd survey. These innovative observations provide 3D spectroscopy of galaxies at a spatial resolution approaching JWST's diffraction limit and a high spectral resolution of Rsimeq2700. The metallicity gradients measured in our galaxy sample range from -0.03 to 0.02 dex~kpc^{-1}. Most galaxies exhibit negative or flat radial gradients, indicating lower metallicity in the outskirts or uniform metallicity throughout the entire galaxy. We confirm a tight relationship between stellar mass and metallicity gradient at zsim1 with small intrinsic scatter of 0.02 dex~kpc^{-1}. Our results indicate that metallicity gradients become increasingly negative as stellar mass increases, likely because the more massive galaxies tend to be more ``disky". This relationship is consistent with the predictions from cosmological hydrodynamic zoom-in simulations with strong stellar feedback. This work presents the effort to harness the multiplexing capability of JWST NIRSpec/MSA in slit-stepping mode to map the chemical and kinematic profiles of high-redshift galaxies in large samples and at high spatial and spectral resolution. 17 authors · Sep 3, 2024
1 Single-image Reflectance and Transmittance Estimation from Any Flatbed Scanner Flatbed scanners have emerged as promising devices for high-resolution, single-image material capture. However, existing approaches assume very specific conditions, such as uniform diffuse illumination, which are only available in certain high-end devices, hindering their scalability and cost. In contrast, in this work, we introduce a method inspired by intrinsic image decomposition, which accurately removes both shading and specularity, effectively allowing captures with any flatbed scanner. Further, we extend previous work on single-image material reflectance capture with the estimation of opacity and transmittance, critical components of full material appearance (SVBSDF), improving the results for any material captured with a flatbed scanner, at a very high resolution and accuracy 5 authors · Feb 20
- AstroCLIP: Cross-Modal Pre-Training for Astronomical Foundation Models We present AstroCLIP, a strategy to facilitate the construction of astronomical foundation models that bridge the gap between diverse observational modalities. We demonstrate that a cross-modal contrastive learning approach between images and optical spectra of galaxies yields highly informative embeddings of both modalities. In particular, we apply our method on multi-band images and optical spectra from the Dark Energy Spectroscopic Instrument (DESI), and show that: (1) these embeddings are well-aligned between modalities and can be used for accurate cross-modal searches, and (2) these embeddings encode valuable physical information about the galaxies -- in particular redshift and stellar mass -- that can be used to achieve competitive zero- and few- shot predictions without further finetuning. Additionally, in the process of developing our approach, we also construct a novel, transformer-based model and pretraining approach for processing galaxy spectra. 14 authors · Oct 4, 2023
- Enhancing Low-Light Images Using Infrared-Encoded Images Low-light image enhancement task is essential yet challenging as it is ill-posed intrinsically. Previous arts mainly focus on the low-light images captured in the visible spectrum using pixel-wise loss, which limits the capacity of recovering the brightness, contrast, and texture details due to the small number of income photons. In this work, we propose a novel approach to increase the visibility of images captured under low-light environments by removing the in-camera infrared (IR) cut-off filter, which allows for the capture of more photons and results in improved signal-to-noise ratio due to the inclusion of information from the IR spectrum. To verify the proposed strategy, we collect a paired dataset of low-light images captured without the IR cut-off filter, with corresponding long-exposure reference images with an external filter. The experimental results on the proposed dataset demonstrate the effectiveness of the proposed method, showing better performance quantitatively and qualitatively. The dataset and code are publicly available at https://wyf0912.github.io/ELIEI/ 6 authors · Jul 9, 2023
2 MolSpectLLM: A Molecular Foundation Model Bridging Spectroscopy, Molecule Elucidation, and 3D Structure Generation Recent advances in molecular foundation models have shown impressive performance in molecular property prediction and de novo molecular design, with promising applications in areas such as drug discovery and reaction prediction. Nevertheless, most existing approaches rely exclusively on SMILES representations and overlook both experimental spectra and 3D structural information-two indispensable sources for capturing molecular behavior in real-world scenarios. This limitation reduces their effectiveness in tasks where stereochemistry, spatial conformation, and experimental validation are critical. To overcome these challenges, we propose MolSpectLLM, a molecular foundation model pretrained on Qwen2.5-7B that unifies experimental spectroscopy with molecular 3D structure. By explicitly modeling molecular spectra, MolSpectLLM achieves state-of-the-art performance on spectrum-related tasks, with an average accuracy of 0.53 across NMR, IR, and MS benchmarks. MolSpectLLM also shows strong performance on the spectra analysis task, obtaining 15.5% sequence accuracy and 41.7% token accuracy on Spectra-to-SMILES, substantially outperforming large general-purpose LLMs. More importantly, MolSpectLLM not only achieves strong performance on molecular elucidation tasks, but also generates accurate 3D molecular structures directly from SMILES or spectral inputs, bridging spectral analysis, molecular elucidation, and molecular design. Code are available at https://github.com/Eurekashen/MolSpectLLM{https://github.com/Eurekashen/MolSpectLLM}. 9 authors · Sep 26